

Note: this page renders multiple data visualizations and is best viewed on a desktop device.
Jail trends from Safety and Justice Challenge (SJC) cities and counties across the country show that it’s possible to successfully reduce the misuse and overuse of jails. This tool, created by the CUNY Institute for State & Local Governance (ISLG), allows users to measure progress achieved by the SJC and explore how jail population trends have changed since implementation.
Explore the different trends in jail populations across SJC sites below:
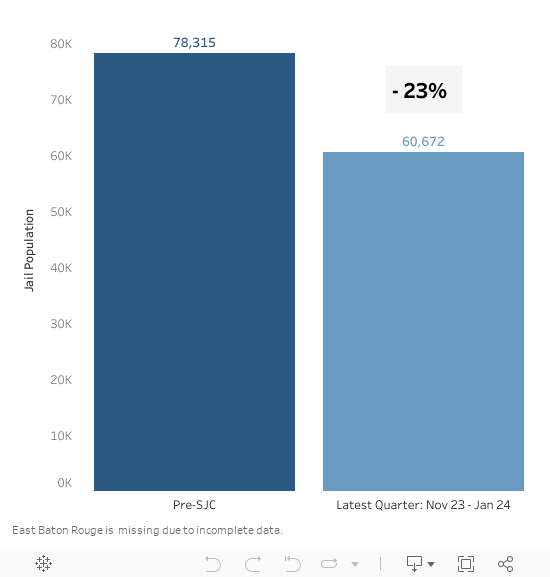
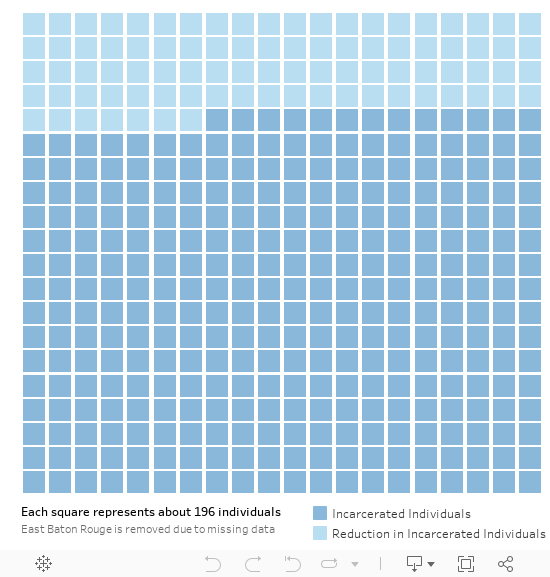
Jail Populations Are Down
Since the initiative launched in 2016, SJC sites across the country have significantly reduced their jail populations.
SJC sites collectively reduced their jail population by 18% since the start of the initiative, resulting in 14,435 fewer people held in jail on any given day. While progress varies across sites, 10 sites reduced their jail population by 15% or more.
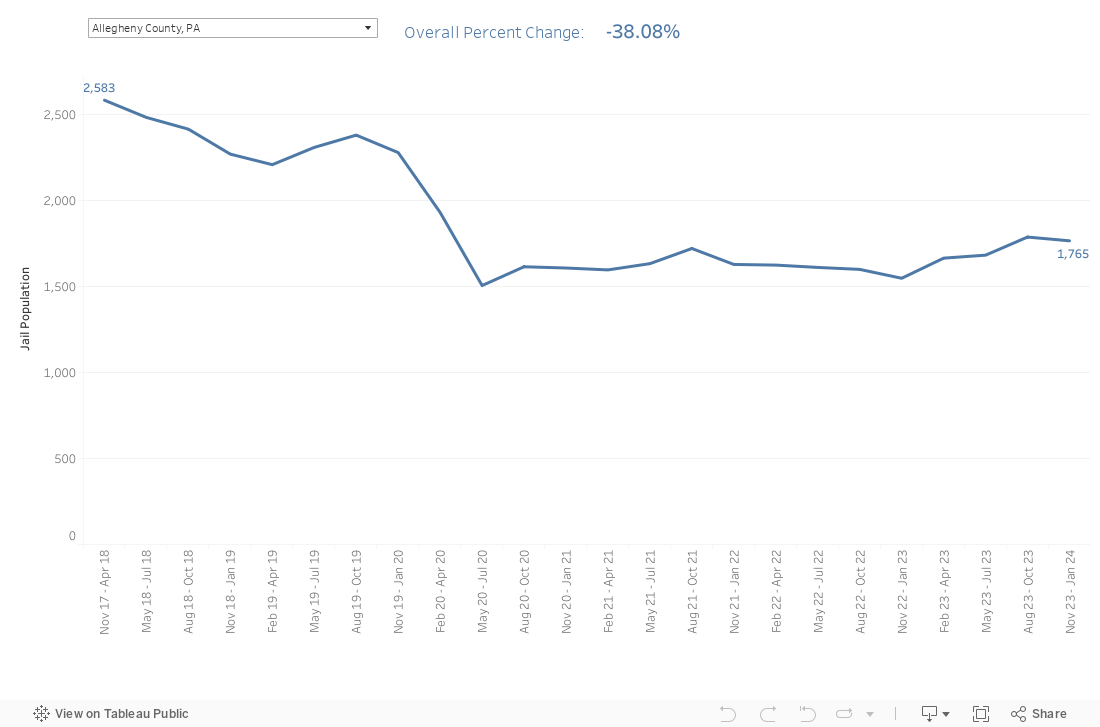
Select a site below to see how jail populations have changed at the local level.
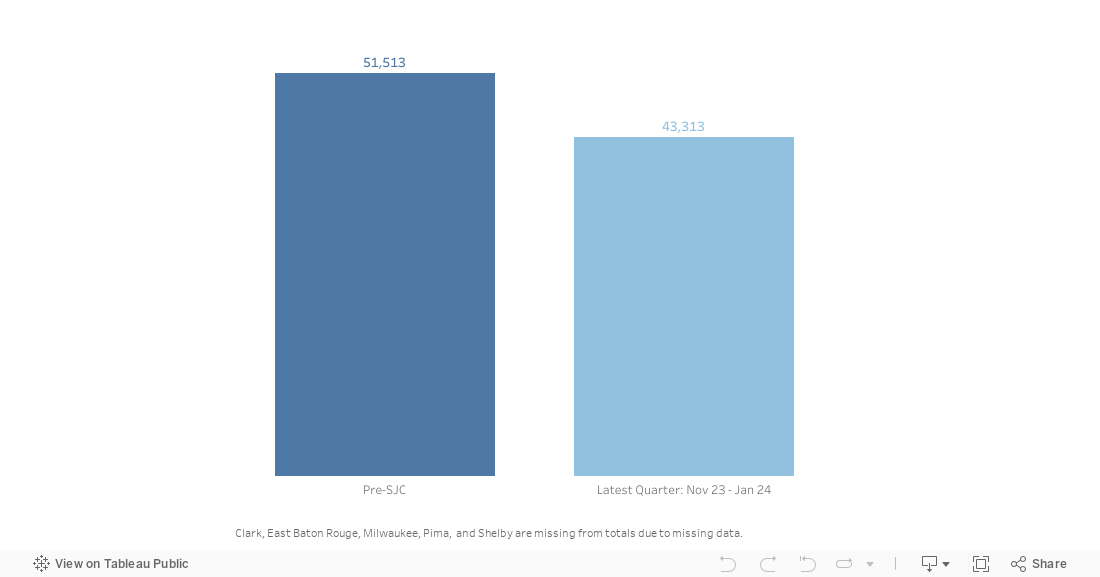
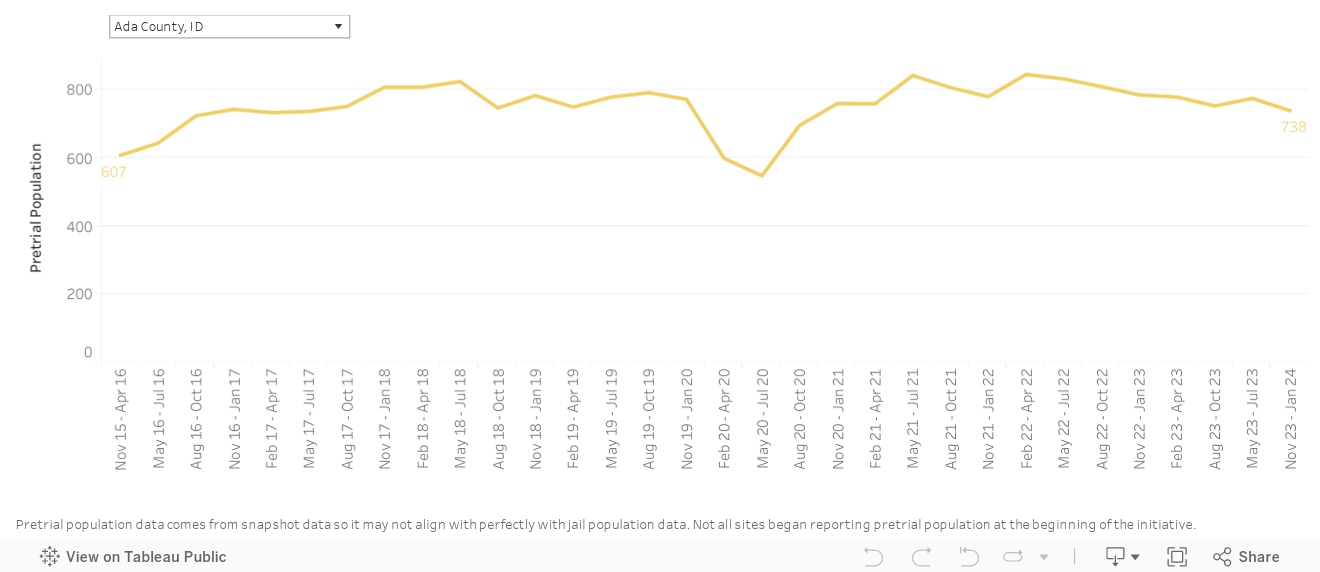
Fewer People Are Held Pretrial
SJC sites successfully implemented strategies to reduce their pretrial jail population and ensure individuals can remain in their community while their case is pending.
SJC sites have collectively reduced their pretrial population by 11% since implementation. This reduction accounted for the majority of the decline in the jail population.
Select a site below to see how the pretrial population has changed at the local level.
SJC Sites Outpaced National Jail Population Declines
When comparing reductions in jail populations, SJC sites achieved greater declines than the national average prior to the pandemic, and declined at a similar rate during the pandemic.
Between 2016 and 2019, the national jail population remained flat (1%) while SJC sites achieved reductions of 11% during the same period. Following the onset of the pandemic, both SJC sites and jails across the country experienced similarly dramatic declines. By 2022, jail populations were down by 19% in SJC sites and 11% nationwide.
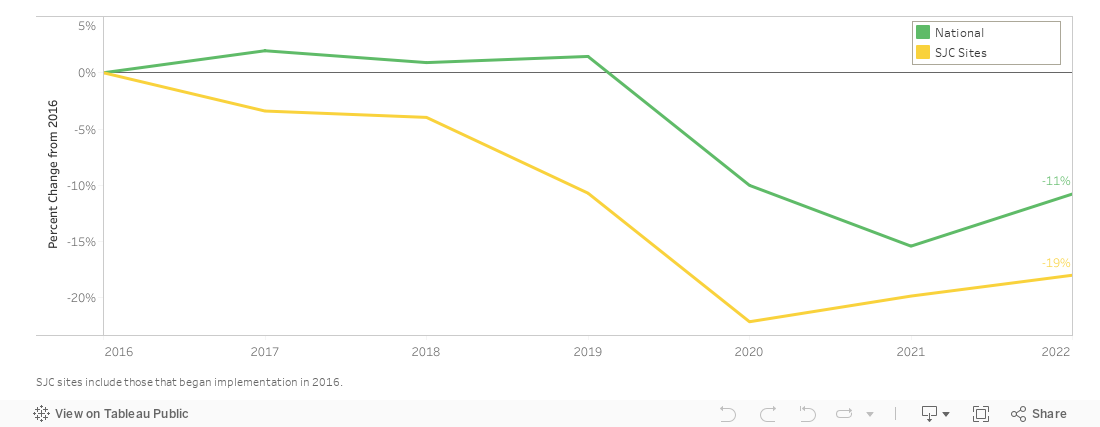
This graph reflects the percent change in jail populations experienced by SJC sites and jails nationally from 2016 to 2022. Current BJS data is only available through 2022.
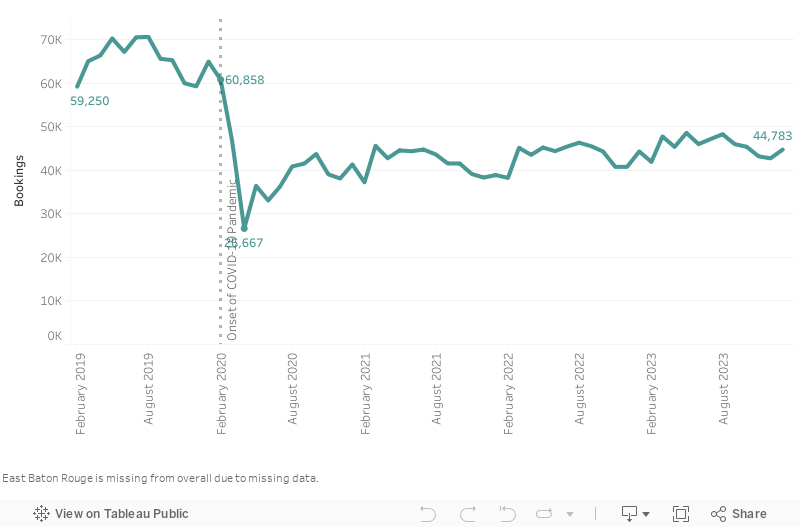
SJC Sites Responded To The COVID-19 Pandemic
The onset of the COVID-19 pandemic caused a sharp drop in bookings, a change partly driven by a reduction in arrests and interaction with law enforcement. Since then, bookings in SJC sites have begun to climb.
While bookings were declining across sites prior to the pandemic, bookings dropped substantially—by 57%—between February 2020 and April 2020. Since the low point in April, bookings have been rising. However, as of the most recent quarter, bookings are still below pre-pandemic levels.
Take a closer look at the effects of COVID-19 on SJC communities with our latest brief: The Fall and Rise of Jail Populations During the Pandemic.
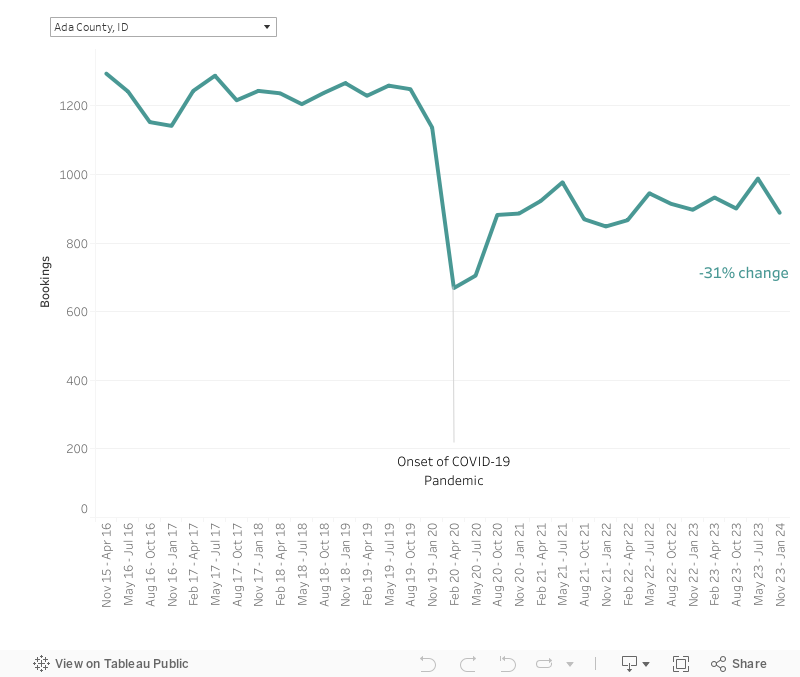
Despite the recent rise in many sites following the lows in April 2020, bookings remain lower now than they were prior to implementation, with an overall reduction of 30%.
Select a site below to see how jail bookings have changed since implementation.
Outcomes Improved For BIPOC Individuals, But Disparities Persist
While outcomes improved for Black, Indigenous, and people of color (BIPOC), improvement in outcomes for white individuals outpaced those for BIPOC populations.
Jail population declined more than 15% for Black populations in 7 sites, Latinx populations in 1 site, and Indigenous populations in 1 of 4 sites. Despite this, declines for white populations were greater, resulting in persistent or increasing disparities. Booking trends followed similar patterns.
Take a closer look at the racial and ethnic disparities in SJC communities and the continued challenges in reducing and eliminating them in our latest brief: Declining Populations, Rising Disparities.
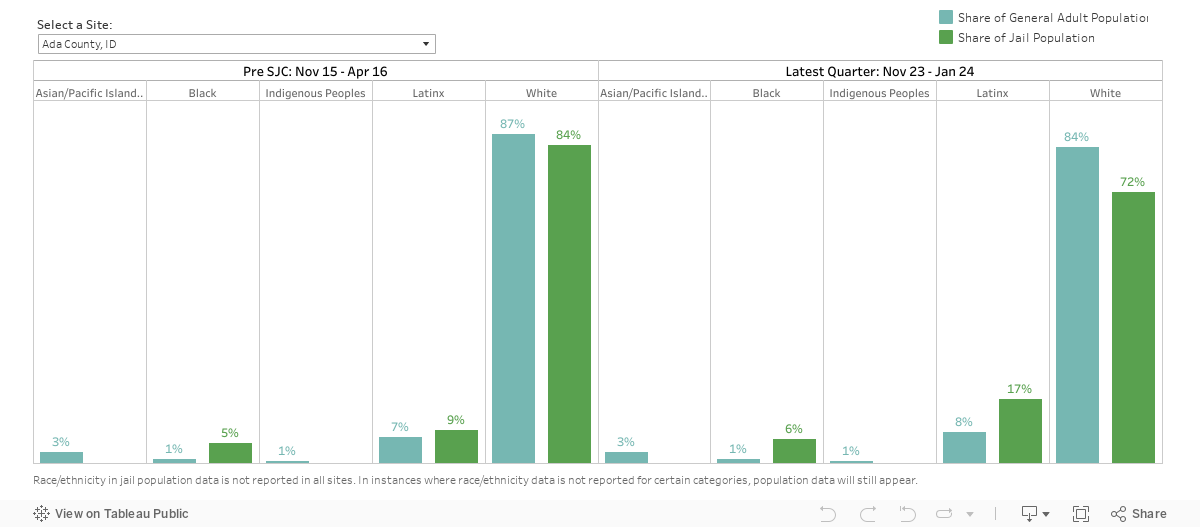
The chart below reflects jail population disproportionality. Disproportionality occurs when a group is either over- or under-represented. Jail Population Disproportionality compares a given racial/ethnic group’s representation in the jail to their representation in the general adult population. A disproportionality ratio higher than 1 indicates over-representation. The higher the number, the greater the disproportionality.
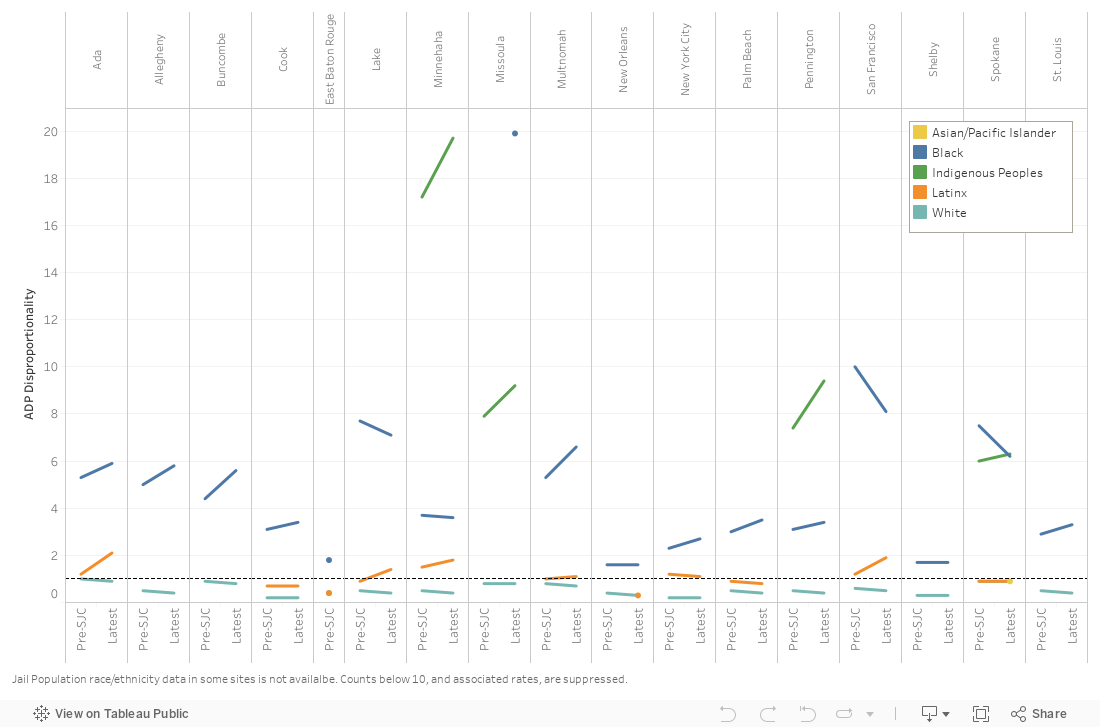
Select a site below to see how racial/ethnic representation has changed in the site since implementation.
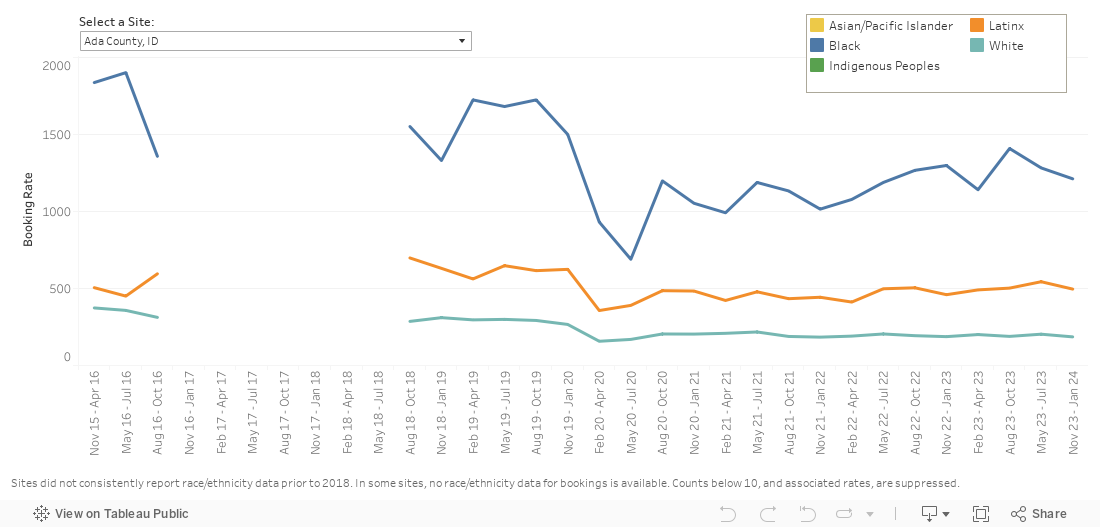
The chart below reflects booking disparities. Disparity occurs when one group experiences an outcome at a higher rate than another group. Booking Relative Rate Index (RRI) is used to measure disparity in jail bookings. An RRI value greater than one indicates that a particular racial or ethnic group are booked at a higher rate relative to White individuals (e.g., a Black/White RRI of two would indicate that Black individuals are booked at twice the rate of White individuals.
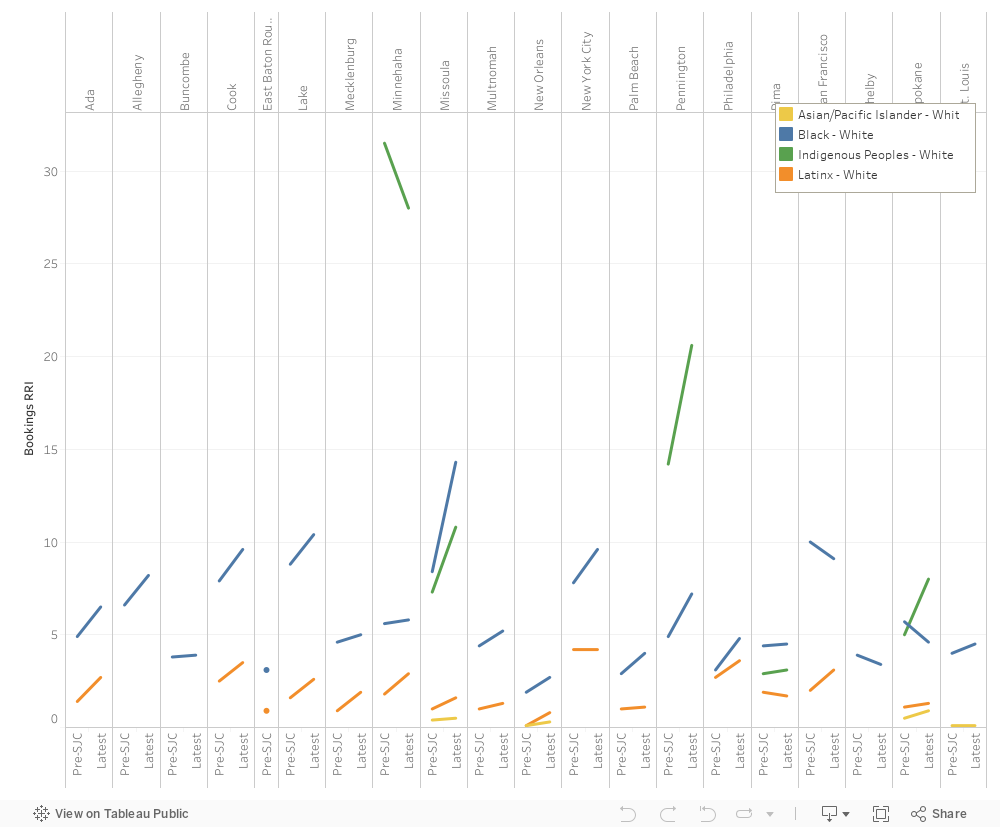
Select a site below to see booking rates by race/ethnicity.
Returns to the Community
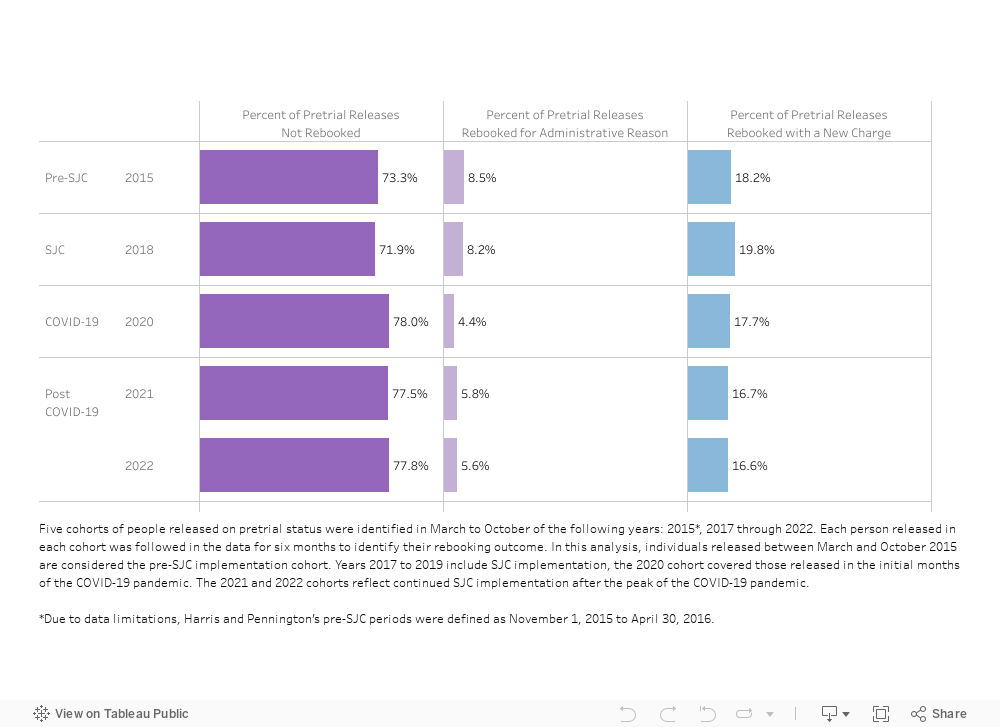
Individuals Released Pretrial to the Community Were No More Likely to Return to Jail for a New Crime after Strategies were Implemented than Before
About 80 percent of people who were released on pretrial status to the community were either not rebooked into jail at all (76 percent) or were returned to jail for administrative reasons (7 percent) – therefore, not a threat to public safety.
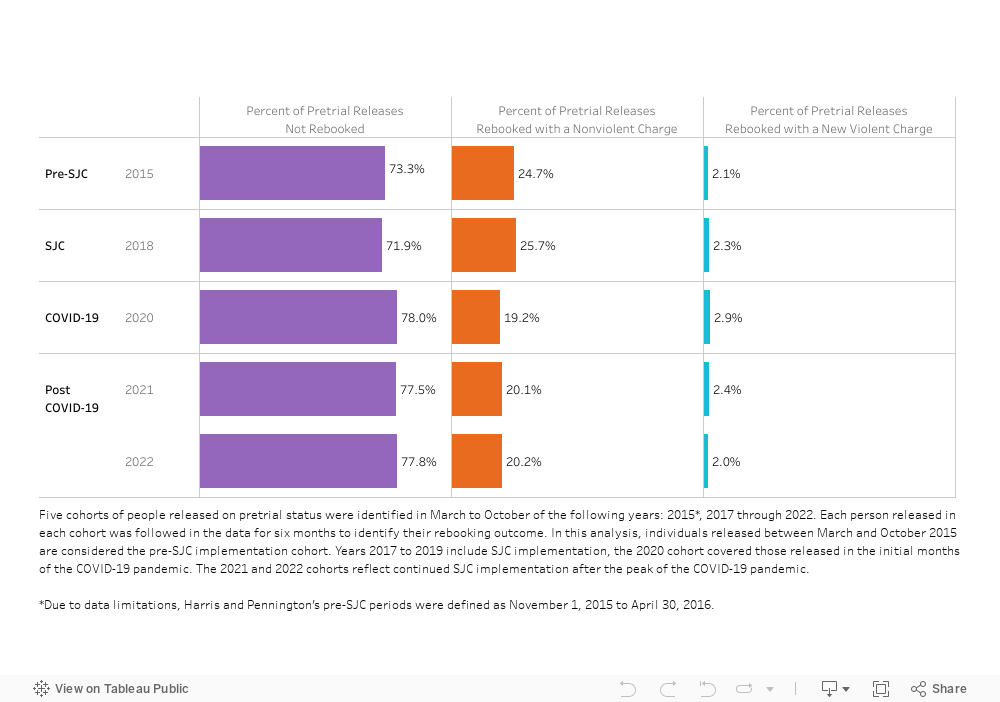
Importantly, people released pretrial were very unlikely to return to jail charged with a violent crime, about 2% of individuals released pretrial returned with a new violent crime charge. This rate has remained consistent for almost a decade, predating reform efforts.
For more detail, see the blog post linked here.
Six cohorts of people released on pretrial status were identified in March to October of the following years: 2015, 2017 through 2023. Each person released in each cohort was followed in the data for six months to identify their rebooking outcome. In this analysis, individuals released between March and October 2015 are considered the pre-SJC implementation cohort. Years 2017 to 2019 include SJC implementation, the 2020 cohort covered those released in the initial months of the COVID-19 pandemic. The 2021 to 2023 cohorts reflect continued SJC implementation after the peak of the COVID-19 pandemic.
New and Administrative Only Charges Violent and Nonviolent Charges
Select a site below to see rebookings trends at the local level:

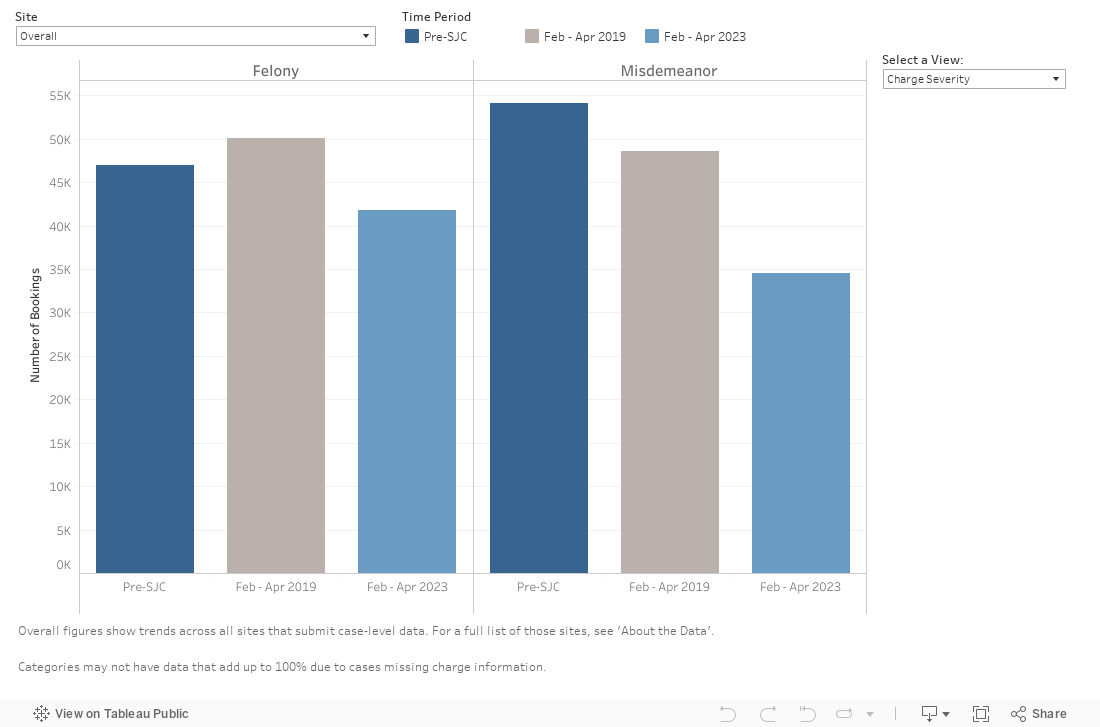
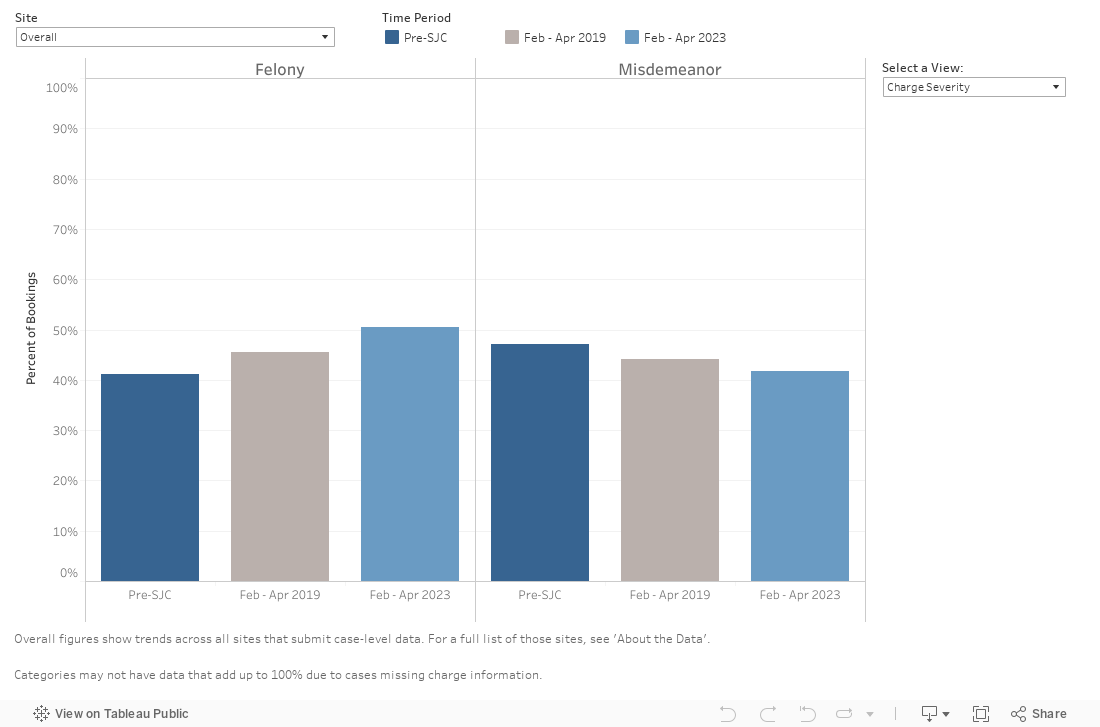
Bookings for Low-Level Charges Plummeted
Since the initiative launched, bookings for low-level charges have significantly decreased in SJC cities and counties.
SJC cities and counties have implemented a range of strategies and policies, including diversion programs and changes to law enforcement and prosecutorial practices, aimed at reducing jail admissions for lower-level non-violent offenses. The number of bookings for misdemeanor charges declined 36% across jurisdictions since the start of the initiative, resulting in an increase in the share of bookings involving more serious crimes in these jails.
View bookings trends across the SJC overall, or select a specific SJC city or county below to see how booking trends for felonies, misdemeanors, violent, and nonviolent charges have changed at the local level since the start of the initiative.

View bookings trends across the SJC overall, or select a specific SJC city or county below to see how booking trends for felonies, misdemeanors, violent, and nonviolent charges have changed at the local level since the start of the initiative.
Overall Length of Stay is Up
Since the start of the initiative, the average number of days individuals spent in jail increased in all but three sites.
Changes in length of stay appear to partially reflect the changing composition of jails. Jails increasingly hold a greater proportion of individuals charged with more serious charges who tend to have longer stays. As shown in the breakdowns below, length of stay increases are concentrated for individuals charged with a felony. Time spent in jail for those with a misdemeanor has decreased in most cities and counties.

Relying solely on the average length of stay masks significant variation within jail populations. To address this limitation, we also include a breakdown of the distribution of days spent in jail. This is useful for understanding whether changes in the overall average are driven by more long stays or fewer short stays. The distribution is also helpful for understanding the impacts of the changing composition of jails which increasingly consist of individuals with higher level charges and longer stays.
Select a city or county below to see how overall length of stay has changed at the local level, along with changes in the distribution of lengths of stay for those charged with a felony or misdemeanor.

Changes in Jail Composition Reflect a Changing Use of Jails
With SJC cities and counties implementing strategies to safely reduce their jail populations, the composition of jails has evolved to reflect this changing use. Most notably, jails hold more individuals charged with higher-severity crimes, and fewer individuals with low-level or administrative charges (e.g., returning to jail on a technical violation). Changes in jail composition based on demographics traits are also evident; while men make up the majority of the jail population, in many sites, the proportion of women held in jails is increasing.
See the chart below to explore how jail composition has changed based on case characteristics across the SJC, or select a specific SJC city or county below to explore these trends at the local level. Demographic characteristics are also shown below.
Case Characteristics Demographics


About the Data
ISLG receives two types of data from SJC cities and counties. Sites submit monthly aggregate measures of their jail populations, including counts of bookings, releases, a one-day count of prisoners by legal status (e.g., pretrial, sentenced, contract, etc.), average daily population, and average length of stay. These data provide more timely tracking of trends in jail populations and racial/ ethnic disparities in between performance measurement reports. Additionally, each year sites submit case-level data across criminal legal system points, which allow ISLG to capture more detailed trends in jail composition and rebooking outcomes. For more information, see Turning Local Data into Meaningful Reforms.
This analysis also uses secondary data sources, including:
- Estimates from the U.S. Census American Community Survey are used in measures that incorporate general population information, including racial/ethnic disparity measures. Rates based on populations (e.g., booking rate) are reported per 100,000 of the adult population (over 18).
- BJS Census of Jails 2022, and Annual Survey of Jails, 2022: Used for national jail population trends.
Unless otherwise noted, the “Pre-SJC” period is a six-month timeframe prior to SJC implementation: November 2015 through April 2016 for all sites where the initiative launched in 2016; and November 2017 through April 2018 for sites where the initiative launched in 2018. Measures are compared with the site’s Pre-SJC baseline to better understand progress since implementation.
Cities and Counties in the Data
| SJC Implementation in 2016 | SJC Implementation in 2018 |
|---|---|
|
Ada County, ID Charleston County, SC Cook County, IL Harris County, TX Los Angeles, CA Lucas County, OH Mecklenburg, NC Milwaukee County, WI Multnomah County, OR New Orleans Parish, LA New York City, NY Palm Beach County, FL Pennington County, SD City of Philadelphia, PA Pima County, AZ Shelby County, TN St. Louis County, MO Spokane County, WA |
Allegheny County, PA Buncombe County, NC Clark County, NV East Baton Rouge Parish, LA Lake County, IL Minnehaha County, SD Missoula County, MT San Francisco, CA |
Tracking Measures by Quarter
Unless otherwise noted, quarterly measures use SJC-specific 3-month intervals: May-July, August-October, November-January, February-April. Quarterly measures are an average of the three months in the quarter.
Race/Ethnicity
Agencies in SJC sites capture race/ethnicity data differently. This variance sometimes limits the ability for sites to report this data consistently and compare across sites; specifically, not all sites track ethnicity separately. For this report, race/ethnicity data is reported in the following categories: Asian/Pacific Islander, Black, Indigenous Peoples, Latinx, and White.
SJC sites began providing race/ethnicity data to ISLG in 2018, whenever possible. All SJC sites did not provide measures broken down by race/ethnicity. These limitations are noted under charts throughout the report.
Definitions
Note: These are the definitions provided to sites for their use in compiling aggregate jail data. However, sites may use slightly different operational definitions for their local jail data, including whether contract or non-local populations are included.
Jail Population: Individuals who are physically confined in jail all or part of the time, with the exception of individuals who are held on contract for another jurisdiction (federal, state, or other), individuals who are held for U.S. Immigration and Customs Enforcement with no other pending or sentenced charges, and juveniles. Jail Population is the daily population of the jail on any given day. It is calculated by adding up the number of people in the jail population in each day of a given period and dividing that figure by the total number of days in the period.
Pretrial: Individuals with one or more pending criminal charge, including those in jail for a probation or parole violation. Individuals who have pending criminal charges and other statuses (e.g., they were sentenced on another charge) are counted in this category. This category may also include people held on warrants and for failure to appear in court.
Jail Booking: Any individual who is booked into the jail (for a pending charge, sentence, warrant, other hold, etc.) during a given period. Bookings are defined to include anyone who is booked and admitted into the jail, booked and released, or transferred to a jail from another facility. Individuals who are booked multiple times in a given period are counted as multiple bookings.
Booking Rates: Bookings rates are calculated by taking the total bookings and general adult population in an individual site, dividing the total bookings by the general adult population, and multiplying by 100,000. For all breakdowns by racial/ethnic group (including legal status), booking rates are calculated by taking the total bookings for that racial/ethnic group, dividing bookings by the general adult population of that racial/ethnic group and multiplying by 100,000.
Jail Population Disproportionality: A measure of over- or under-representation of a particular racial/ethnic group in the jail on any given day, compared to their representation in the general adult population. The disproportionality ratio is calculated through a two-step process: The first step is to divide the ADP for that racial/ethnic group in the jail by the total number of people in the jail, and the number of people in the general adult population in that racial/ethnic group by the total adult population in the jurisdiction. The second step is to divide the proportion of that racial/ethnic group in the jail by the proportion of that racial/ethnic group in the general adult population. Numbers higher than one reflect disproportionately higher representation of that racial/ethnic group in the jail on a given day (the higher the number, the greater the disproportionality). Numbers below one reflects disproportionately lower representation of that racial/ethnic group.
Booking Relative Rate Index: The relative rate index (RRI) is a measure of over- or under-representation of particular racial/ethnic groups, compared to a reference group, in the rate of jail bookings in the jurisdiction. For this report, the reference group is White people (see definition). The RRI is calculated through a two-step process: First, separate booking rates per 100,000 county residents for groups of interest (e.g., people of color, Black, Latinx, and White people) are calculated. Next, booking rates per 100,000 for each racial/ethnic group of interest are divided by the booking rate for White people. This final result is the RRI. RRI numbers higher than one reflects disparately higher booking rates for the racial/ethnic group of interest, relative to White individuals (the higher the number the greater the disparity). Numbers below one reflects disparately lower rates for the racial/ethnic group of interest, relative to White individuals. For example, if the RRI of people of Color is 0.9, this indicates that people of color have a disparately lower booking rate as a group than White people.
Returns to the Community (Pretrial Releases): Returns to the community are defined as individuals who are released pretrial.
People released on pretrial status are individuals who have been released from physical jail custody pend¬ing the disposition of one or more of their booking charges. People may be released pretrial via bail, bond, supervision, or release on recognizance. These individuals are still under the authority of local criminal legal agencies and are closely impacted by changes to policy and practice pursued under the SJC.
For this analysis, five cohorts of people released on pretrial status were identified in March to October of the following years: 2015 and 2017 through 2022. Each person released in each cohort was followed in the data for six months to identify whether they returned to jail (and on what type of charge).
New Charge and Administrative Charge: A person was rebooked into jail on a new charge, defined as being arrested and booked into jail with at least one new criminal offense. This excludes people who were rebooked into jail because of administrative reasons such as failure to appear in court, probation violation, or violation of pretrial conditions.
Violent Charges: Charges are identified as violent based on the FBI’s Uniform Crime Reporting (UCR) Program. Violent crime is composed of four offenses: murder and nonnegligent manslaughter, rape, robbery, and aggravated assault.
Contact
For data questions, please contact data@islg.cuny.edu.