Reflections on My Time Reducing Jail Populations in Charleston County and the Journey Ahead

By: Kristy Danford

Community Engagement Data Analysis Incarceration Trends August 3, 2022

As I step down from a Safety and Justice Challenge role I’ve served in since 2015, I’m proud of what we achieved together in Charleston, SC and hopeful for the future of justice reform. I am optimistic the progress can provide a path for other communities to sustainably improve their local systems while safely reducing the misuse and overuse of jails.

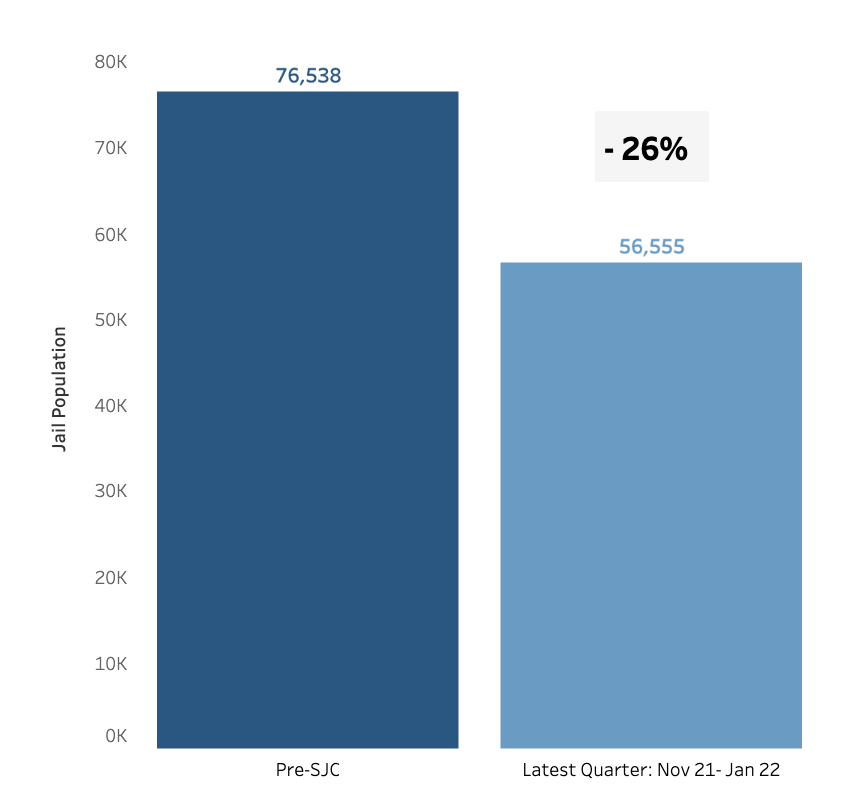
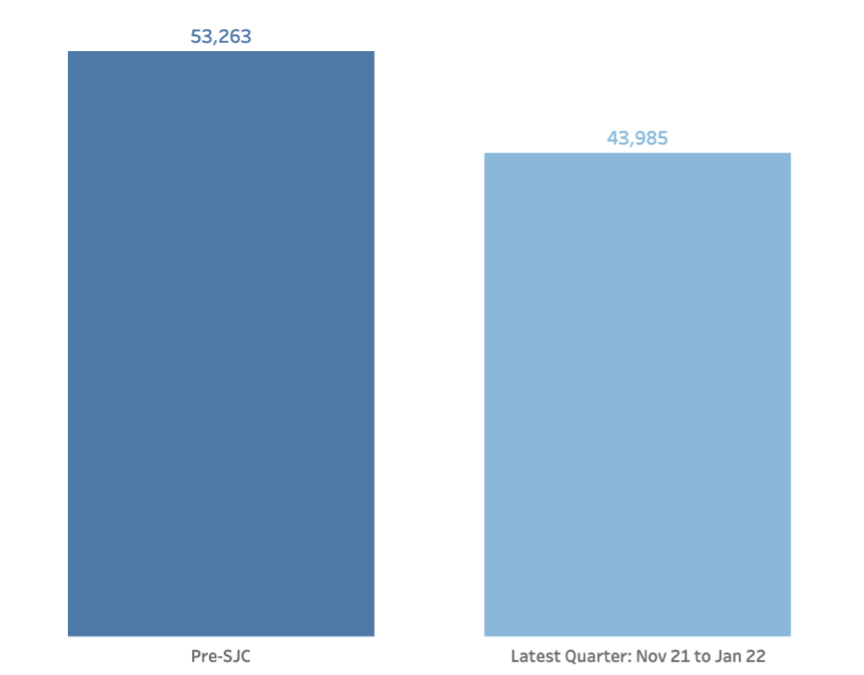
As reported in our 2021 Annual Report, Charleston County’s local jail population was reduced 40 percent from our initial baseline in 2014 to 2021. Municipal and Magistrate charges booked into our jail were cut by 80 percent. The rate of local bookings among our adult population decreased by 67 percent. The rate of local bookings among Black adults decreased from 178 per 1,000 Black adults to 58. The number of unique individuals repeatedly cycling through our jail, most often on lower-level charges, decreased by 71 percent. At the same time, Circuit Court charges booked into our jail kept steady and our crime trends remained similar to that in the rest of our state–which did not enact our reforms. We now have even more refined data and expertise to lead the way forward in making our local system more effective, equitable and efficient.

Those results have not happened by accident. They are the result of intentional data-guided collaborations between diverse stakeholders in Charleston, from executives leading agencies within the system to diverse members of our community. We came together, cutting across lines of responsibility and power, to objectively look at how our system was serving all of us and found sustainable ways to do more good than harm. We made it better by forming a Criminal Justice Coordinating Council (CJCC), assuming nothing, rethinking expectations, and continually using data to guide us. While there is more work to be done, the CJCC’s efforts moving forward will continue to be focused and intentional. For instance, the evidence-base is clearly pointing the way forward to reducing the time from arrest to disposition and improving pretrial outcomes.

Before joining the SJC I experienced the gap between what jurisdictions and/or independent justice system agencies were trying to do with reform measures and what was happening on the ground in local communities. If you have seen my TEDx talk you know my journey led me from experiencing the system first-hand, to working on the front lines in probation and parole, to working within organizations and legislative spaces trying to bring about greater alignment between what the research shows works and what actually happens, day-in and day-out.

Wherever I was working in the country, the gap between intentions for reform, and what was happening on the ground, persisted. It was natural because change is challenging. The challenges are also exacerbated by the constant barrage of hot button issues in the news. I found that jurisdictions often whacked one mole on the road to reform, only to find another mole pop up. It was disorienting and exhausting. I’d had enough of the reactive whack-a-mole approach and wanted to take a more proactive and sustainable localized approach to reform.

I came to realize if I really wanted to help make a system work better for the families and communities it served, I had to go local, and it had to be done with a collective body of system leaders and representatives of the community they served. I was convinced if we singularly focused our reform efforts on pulling one policy lever or another, or focused too much on one decision-maker or another, reforms would continue to come up short. To truly reform the system, we had to focus on the whole system.

Every decision-maker in the “system” and every decision mattered. Together, we could form a CJCC, assess how our system was working, set specific goals, and measure progress against those goals. After a lot of reflection, I came up with my dream job. I wanted to work hand-in-hand with local system actors and the communities they served. I wanted to form a CJCC, to use data to ground the dialogue, and to look beyond the next mole that pops up. While I was convinced this had to be the way forward, there were not many others willing to give it a shot, and there were no staffed CJCCs in South Carolina.

Then along came MacArthur’s Safety and Justice Challenge (SJC). When it launched, I stepped up to serve as a volunteer in Charleston alongside some brave early adopters. Together, we eventually formed the Charleston CJCC.  We challenged one another, learned from each other, and became one of the first communities to join SJC. Over the last seven years, our CJCC has grown. It went from a scrappy startup to a mainstay in the community leading the way for others. While we remain the only community from South Carolina in the SJC, additional CJCCs are forming across the state. The collaborative, data-guided work of our CJCC is also contributing to the development of the first-ever national standards for CJCCs.

My vision is to see this kind of transformation take place across the country. There are roughly 3,000 counties across America and many of them lack the kind of sustained data-guided collaboration we have managed to pull together in Charleston and across many SJC cities and counties. Every community can and should have a high-functioning CJCC that brings diverse stakeholders together to look at its data, to see how its system is functioning, set specific goals, monitor their progress, and make it happen. Inevitably, the data will point to inefficiencies and inequities and countless stories of harms done. The data will also point to a number of opportunities to do more good than harm. I implore anyone reading this to be on the lookout for the forthcoming CJCC national standards published by the National Institute of Corrections in conjunction with the National Network of CJCCs and to strive to live them out.

As criminal justice reforms continue to evolve, I urge my colleagues to embrace data and constructive dialogue as their guide, stay focused on what makes their community safer and more just, and keep coming together. CJCC’s provide a sustainable forum for us all to demand collective accountability from the entire system and foster the learning environment necessary to make it happen.

Personally, it has been a challenging and rewarding experience to get to live out this journey, and I am excited for the continued efforts of the Charleston CJCC and CJCCs across the country. Meanwhile, I am also a mother who feels like time is moving way too fast. So, I am about to embark on my next journey to spend more time with my kids. For now, I am taking a step back from full-time work before that brief window of childhood closes and the next chapter opens.

I wish my colleagues at SJC sites across the country continued success as we continue to collaborate locally and across the country to do more good than harm.

What Is Behind the Overrepresentation of People Who Identify as LGBTQ+ in the Criminal Legal System?

By: Jane Hereth, PhD, MSW

Data Analysis Incarceration Trends LGBTQ June 24, 2022

A new Safety and Justice Challenge report explores the factors contributing to the overrepresentation in the criminal legal system of people who identify as lesbian, gay, bisexual, transgender, queer, or who hold other marginalized gender identity and/or sexual orientation identities (LGBTQ+). The report–which was released with funding support from the MacArthur Foundation–also explores how LGBTQ+ people or color and LGBTQ+ people with disabilities experience even higher rates of system involvement than their White LGBTQ+ peers.

A full copy is available for download here.

Documenting the number of LGBTQ+ within the criminal legal system is difficult because of the evolving terminology, a lack of uniform data collection, and people’s discomfort with disclosure in the system. Despite difficulties with data collection, emerging data indicate that LGBTQ+ individuals experience high rates of arrest and incarceration. According to an analysis of data from the National Survey on Drug Use and Health, gay, lesbian, and bisexual individuals were 2.25 times more likely to be arrested in the last year when compared to heterosexual individuals. Data from the 2015 National Transgender Discrimination Survey (NTDS) assessed arrest just within the last year and found that 6 percent of Black transgender women and 6 percent of Native American transgender women reported at least one arrest. By comparison, an estimated 3 percent of the overall U.S. population is arrested each year. According to a study using data from the National Inmate Survey, the incarceration rate of people who self-identified as lesbian, gay, or bisexual was three times that of the general U.S. population.

The report focuses on several things that contribute to LGBTQ+ people’s overrepresentation, as well as some ways they are impacted while in jail:

Discrimination by System Actors

LGBTQ+ individuals report high rates of discrimination and harassment by criminal legal system actors, including police, judges, and prison staff. A study of lesbian, gay, bisexual, and transgender individual’s experiences of discrimination within the criminal legal system conducted by Lambda Legal found that 73 percent of respondents had face-to-face contact with the police within the past five years. Almost a quarter reported that police had a hostile attitude towards them. Furthermore, the study found that, among respondents who had been involved in the court system in the last five years, 19 percent overhead a judge, attorney, or other court employee make negative comments about their sexual orientation, gender identity, or expression.

Conditions of Confinement

Inside jails and prisons, LGBTQ+ individuals experience heightened harassment and abuse. Prison and jail staff are often the perpetrators of this victimization; according to Lambda Legal’s report, among survey respondents with a history of incarceration 7 percent were sexually assaulted, 12 percent were physically assaulted, 27 percent were sexually harassed, and 57 percent were verbally assaulted or harassed by jail or prison staff. Staff also fail to prevent victimization; according to a survey conducted by Black & Pink of incarcerated LGBTQ+ individuals, 76 percent of respondents believe that prison staff intentionally placed them in situations where they were likely to be sexually assaulted by another prisoner. Incarcerated LGBTQ+ youth and adults report high rates of placement in solitary confinement while incarcerated.

Healthcare Barriers

People in jail who identify as LGBTQ+ are routinely denied inclusive health care, particularly transgender affirming care and HIV treatment. Black & Pink’s survey of LGBTQ+ inmates found that 67 percent of respondents had been diagnosed with a mental illness, yet 48 percent of people with a diagnosis were not receiving mental health therapy. Many transgender individuals choose to receive hormone therapy as a component of medically affirming one’s gender.

Criminalization of LGBTQ+ Identities

In recent U.S. history, stereotypes about deviance were perpetuated by laws targeting LGBTQ+ communities, such as those that criminalized homosexual sex and wearing clothing of the “opposite” sex. These laws have, for the most part, been overturned or repealed, or are no longer enforced, yet they contributed to lasting cultural representations and perceptions of LGBTQ+ individuals as deviant.

More recent laws criminalize aspects of LGBTQ+ identities in less direct ways. For example, in recent years many states have attempted to pass legislation restricting access to public restrooms and locker rooms for transgender individuals.

Regardless of engagement in criminalized activities, LGBTQ+ people are subjected to heightened police surveillance due to these perceptions of deviance. Additionally, this bias contributes to disparities in charges filed, adjudication, and sentencing of LGBTQ+ individuals.

The School-To-Prison Pipeline

Many LGBTQ+ students experience bullying in school. According to the most recent National School Climate Survey, 82 percent of lesbian, gay, bisexual, and transgender respondents had experienced verbal harassment at school, and 36.7 percent reported being physically harassed. Yet many do not receive help from school staff and instead defend themselves, which often results in punishment in accordance with so-called “zero tolerance” policies. Additionally, LGBTQ+ youth, particularly LGBTQ+ youth of color, are more likely to be punished for non-violent school infractions, such as public displays of affection and dress code violations.

Homelessness, Unemployment, and Poverty

Due to a complex web of family rejection, homelessness, unemployment, poverty, bias, and discrimination, LGBTQ+ individuals may turn to criminalized activities like theft, panhandling, and sex work in order to survive. Heightened police surveillance increases the likelihood of LGBTQ+ individuals being arrested and charged for forms of criminalized survival. LGBTQ+ individuals with a history of criminal legal system involvement experience heightened discrimination and exclusion from employment, education, and other opportunities because of their records, leading to continued homelessness, unemployment, and poverty. This creates a revolving door back into the system.

Violence and Victimization

LGBTQ+ individuals experience high rates of violence and victimization, including child abuse, intimate partner violence, sexual assault, and bias-related victimization. Yet many LGBTQ+ individuals feel uncomfortable seeking support, especially from the police.

Lacking legal or other supportive services, many LGBTQ+ individuals are left with few good options to protect themselves from victimization. There are no available data regarding the number of LGBTQ+ individuals who have been arrested or incarcerated for defending themselves from victimization.

Interrupting Pathways to Incarceration

The report spotlights organizations across the country working to interrupt these pathways and by extension, reduce the overrepresentation of LGBTQ+ people in the system. AA full copy is available for download here.

Research Report

Human Toll of Jail Incarceration Trends LGBTQ Racial and Ethnic Disparities June 24, 2022

Overrepresentation of People Who Identify As LGBTQ+ In The Criminal Legal System

Jane Hereth, Assistant Professor of Social Work, Helen Bader School of Social Welfare, University of Wisconsin-Milwaukee

Individuals who identify as lesbian, gay, bisexual, transgender, queer, or who hold other marginalized sexual orientation and/or gender identities (LGBTQ+) are overrepresented within the criminal legal system. LGBTQ+ people of color and LGBTQ+ people with disabilities experience even higher rates of criminal legal system involvement than their White LGBTQ+ peers. This report will review factors contributing to these disparities. Additionally, the report will highlight the work of organizations addressing the needs of LGBTQ+ individuals involved in the criminal legal system and outline recommendations to address overrepresentation.

How to Use Our New Jail Trends Tool

By: Cecilia Low-Weiner

Data Analysis Incarceration Trends May 22, 2022

There is great news for people looking to understand how jail populations are changing across the country: The Safety and Justice Challenge (SJC) has a new tool enabling anyone to track progress of SJC site jails.

The jail trends tool distills all the progress achieved across SJC sites since the Challenge began. Users can click through to different tabs to explore key trends across SJC sites and can drill down in each of these trends to view them on an individual site basis for a more nuanced local perspective.

We are also planning a series of accompanying briefs over the coming months, which will be available here as they’re released. Each brief will take a more detailed look at specific findings and provide additional context to help explain the trends.

Below is an overview of how users can interact with the tool and a highlight of some of the key findings.

Tracking Jail Populations by SJC site

One of the primary goals of the Safety and Justice Challenge is to reduce the misuse and overuse of jails. Users can select a specific SJC community to see how local jail populations have changed since before they joined SJC, to the most recent available quarter. Overall, SJC communities collectively reduced their jail population by 26% since the start of the SJC, resulting in 19,983 fewer people held in jail on any given day. While progress varies across sites, 15 sites reduced their jail population by 15% or more.

Looking at Pretrial Populations

Communities participating in SJC have successfully implemented a variety of strategies to reduce the pretrial jail population and ensure people can stay in their communities while their case is pending. Users can select individual sites to see how their pretrial population has changed. Overall, SJC communities have collectively reduced their pretrial populations by 18% since the SJC began.

Comparing SJC Sites to National Jail Population Declines

One yardstick for understanding jail population change in SJC communities is a comparison with jail population trends nationally. Overall, the population decline in communities participating in SJC outpaced the national jail population decline prior to the pandemic, and declined at a similar rate during the pandemic. Between 2016 and 2019 the national jail population remained flat. Among SJC communities that began implementation in 2016, jail populations declined by 11% during the period. After the onset of the pandemic SJC sites mirrored the national jail population reduction of around 27% between June 2019 and June 2020.

SJC Sites’ Response to the COVID-19 Pandemic

The COVID-19 pandemic had a significant impact on jail populations – particularly on jail bookings. In this tab, users can select a community to see how the pandemic affected local jail booking trends. While bookings were declining across sites before the pandemic, bookings dropped substantially, by 57%, between February 2020 and April 2020. Since the low in April, bookings have been rising in most SJC communities. However, as of the most recent quarter, they are still below pre-pandemic levels.

Tracking Racial Disparities

The other core goal of the Safety and Justice Challenge is to reduce racial and ethnic disparities in jail populations. Since implementation, outcomes improved for people of color across SJC communities, but improvements in outcomes for White people outpaced those for people of color. Jail populations declined by more than 15% for Black populations in 10 SJC communities, for Latinx populations in six, and for Indigenous populations in one of four communities. Despite this, declines for White populations were greater. That resulted in persistent or increasing disparities. Users can view disparities for both jail populations and bookings both across SJC sites and at the individual site level.

Future Innovation

Now that the tool is live, we are working with SJC sites and other stakeholders to bring more findings to the public, including trends in length of stay, and further information on how the composition of jail populations has changed over time – in addition to making quarterly updates to the data already publicly available. Please check back regularly to see what’s new!

Research Report

Housing Incarceration Trends Probation Racial and Ethnic Disparities May 5, 2022

Trends in Jail Incarceration for Probation Violations

Rochisha Shukla, Ammar Khalid, Arielle Jackson

Urban Institute report on Trends in Jail Incarceration for Probation Violations

In partnership with the Adult Probation Department in Pima County, Arizona, and as part of broader research funded by the Safety and Justice Challenge to examine the impact on jail use of providing housing supports for people on probation in Pima County, the Urban Institute analyzed trends in jail incarceration for people with probation violations using datasets for overall jail bookings in the county from 2015 to 2020 and petitions-to-revoke for people on probation from 2016 to 2020. This case study summarizes our findings on patterns in overall jail bookings and petitions-to-revoke and, for the probation population in jail, analyzes average lengths of stay and patterns by race and ethnicity and sex.